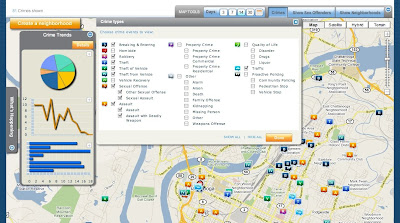
CrimeReports provides departments with a way to share their incident reports with citizens through an easy to use map interface. It appears to be a Flash wrapper around a Google Map rendered through the Google Maps API from the incident file.
To use the site, simply type in a location in the My address field and click Search. (You can just put in Chattanooga if you don't wont your address added to their database.) In addition to crime incidents, it also provides detailed information on registered sex offenders, including their address and for many a photograph and physical description. Careful with that data, there is a disclaimer you have to agree to when using it. If you are just looking for crime incidents, you can toggle the sex offender layer off. (This data layer seems to come from an API call to the state registry.)
Now that you have defined the area you want to look at, you just have to pick the time frame you want to see and the crime types from the Map Tools bar in the upper right of the screen. You have a choice of 3,7,14 and 30 days for the quick links, or a custom time frame from the calendar. CrimeReports is going to show you a moving window of 6 months, so if you think you will want to see data from June 10th sometime in the future, you would want to capture that data today. The Crime Types pop up allows you to select up to 30 incident classifications. Once selected and applied, you get a map showing those incidents in the time frame chosen.

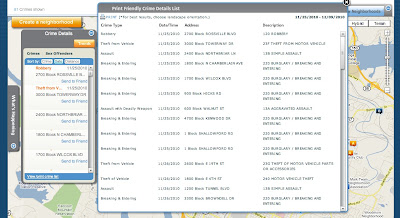
Exploring your map is fairly intuitive, you click on an incident icon and get a pop up that gives you the date, block location, police report number(?), time, UCR classification, and reporting agency. You can also email the incident to a friend from the pop up. One of the best features is the Crime Details toolbar on the left side of the screen. From there you can get a list of incidents by crime, date, and distance. Click on the Trends button and you get can get your graph on. Click on a graph to enlarge it. Click back on the Details button and look at the bottom of the window, you can print a list of all incidents in your filter. Very nice. Unfortunately, it isn't easy to copy and paste that info out because it is a Flash pop up. I even printed it to pdf and couldn't extract it because it is an image, oh well.

There is also a neighborhood feature pending, click on Create a Neighborhood to see the status message. This could be an interesting feature, but I can see how it would be impossible to control.
Nice tool, easy to use, and now that you know how it works, you should get the free CrimeReports iPhone app! It is a very nice app that can, of course, use your current location and show incidents reported near your location. If you create an account with the site, you can even setup alerts for reports. Of course, these alerts will only fire when the file containing the incident is uploaded, so the alert could be 3 days old when you get it, but it is still a very nice feature.
So now you have looked at all the incidents reported around you and seen trends over 6 months... now what?
If you are interested in the trends for these crimes in an area, you can always hit up the SOCRR Public safety report from the Ochs Center. For incident counts and trends over 5 years, choose a neighborhood and play with the Tableau Public interface, I also posted one a while back.
If you are interested in gaining insight into a particular incident or series of incidents, then you need some more tools to use along with the map. I will outline some of these in upcoming posts. A hint to what is next... you noticed that the data CrimeReports gives you only provides a block location and not an address of the incident. Well, and I may be making some assumptions here, the Google Maps API isn't going to map with any level of acceptable accuracy a block location. It needs something like an address. If you zoomed in on any incidents, they are sitting on top of a parcel. Oh yeah...


